Practice 1,000 real breakouts before you risk a dollar.
Drill real historical setups, then a live scanner runs the same rules on today’s market. The setup you drill is the one you trade.
The edge is in the rules. The drill builds the discipline.
Most traders fail not because they lack a strategy, but because they can’t execute it consistently. That’s what the drills fix.
Study the rules
Short lessons on base structure, volume, and entry mechanics. No theory overload.
Drill real setups
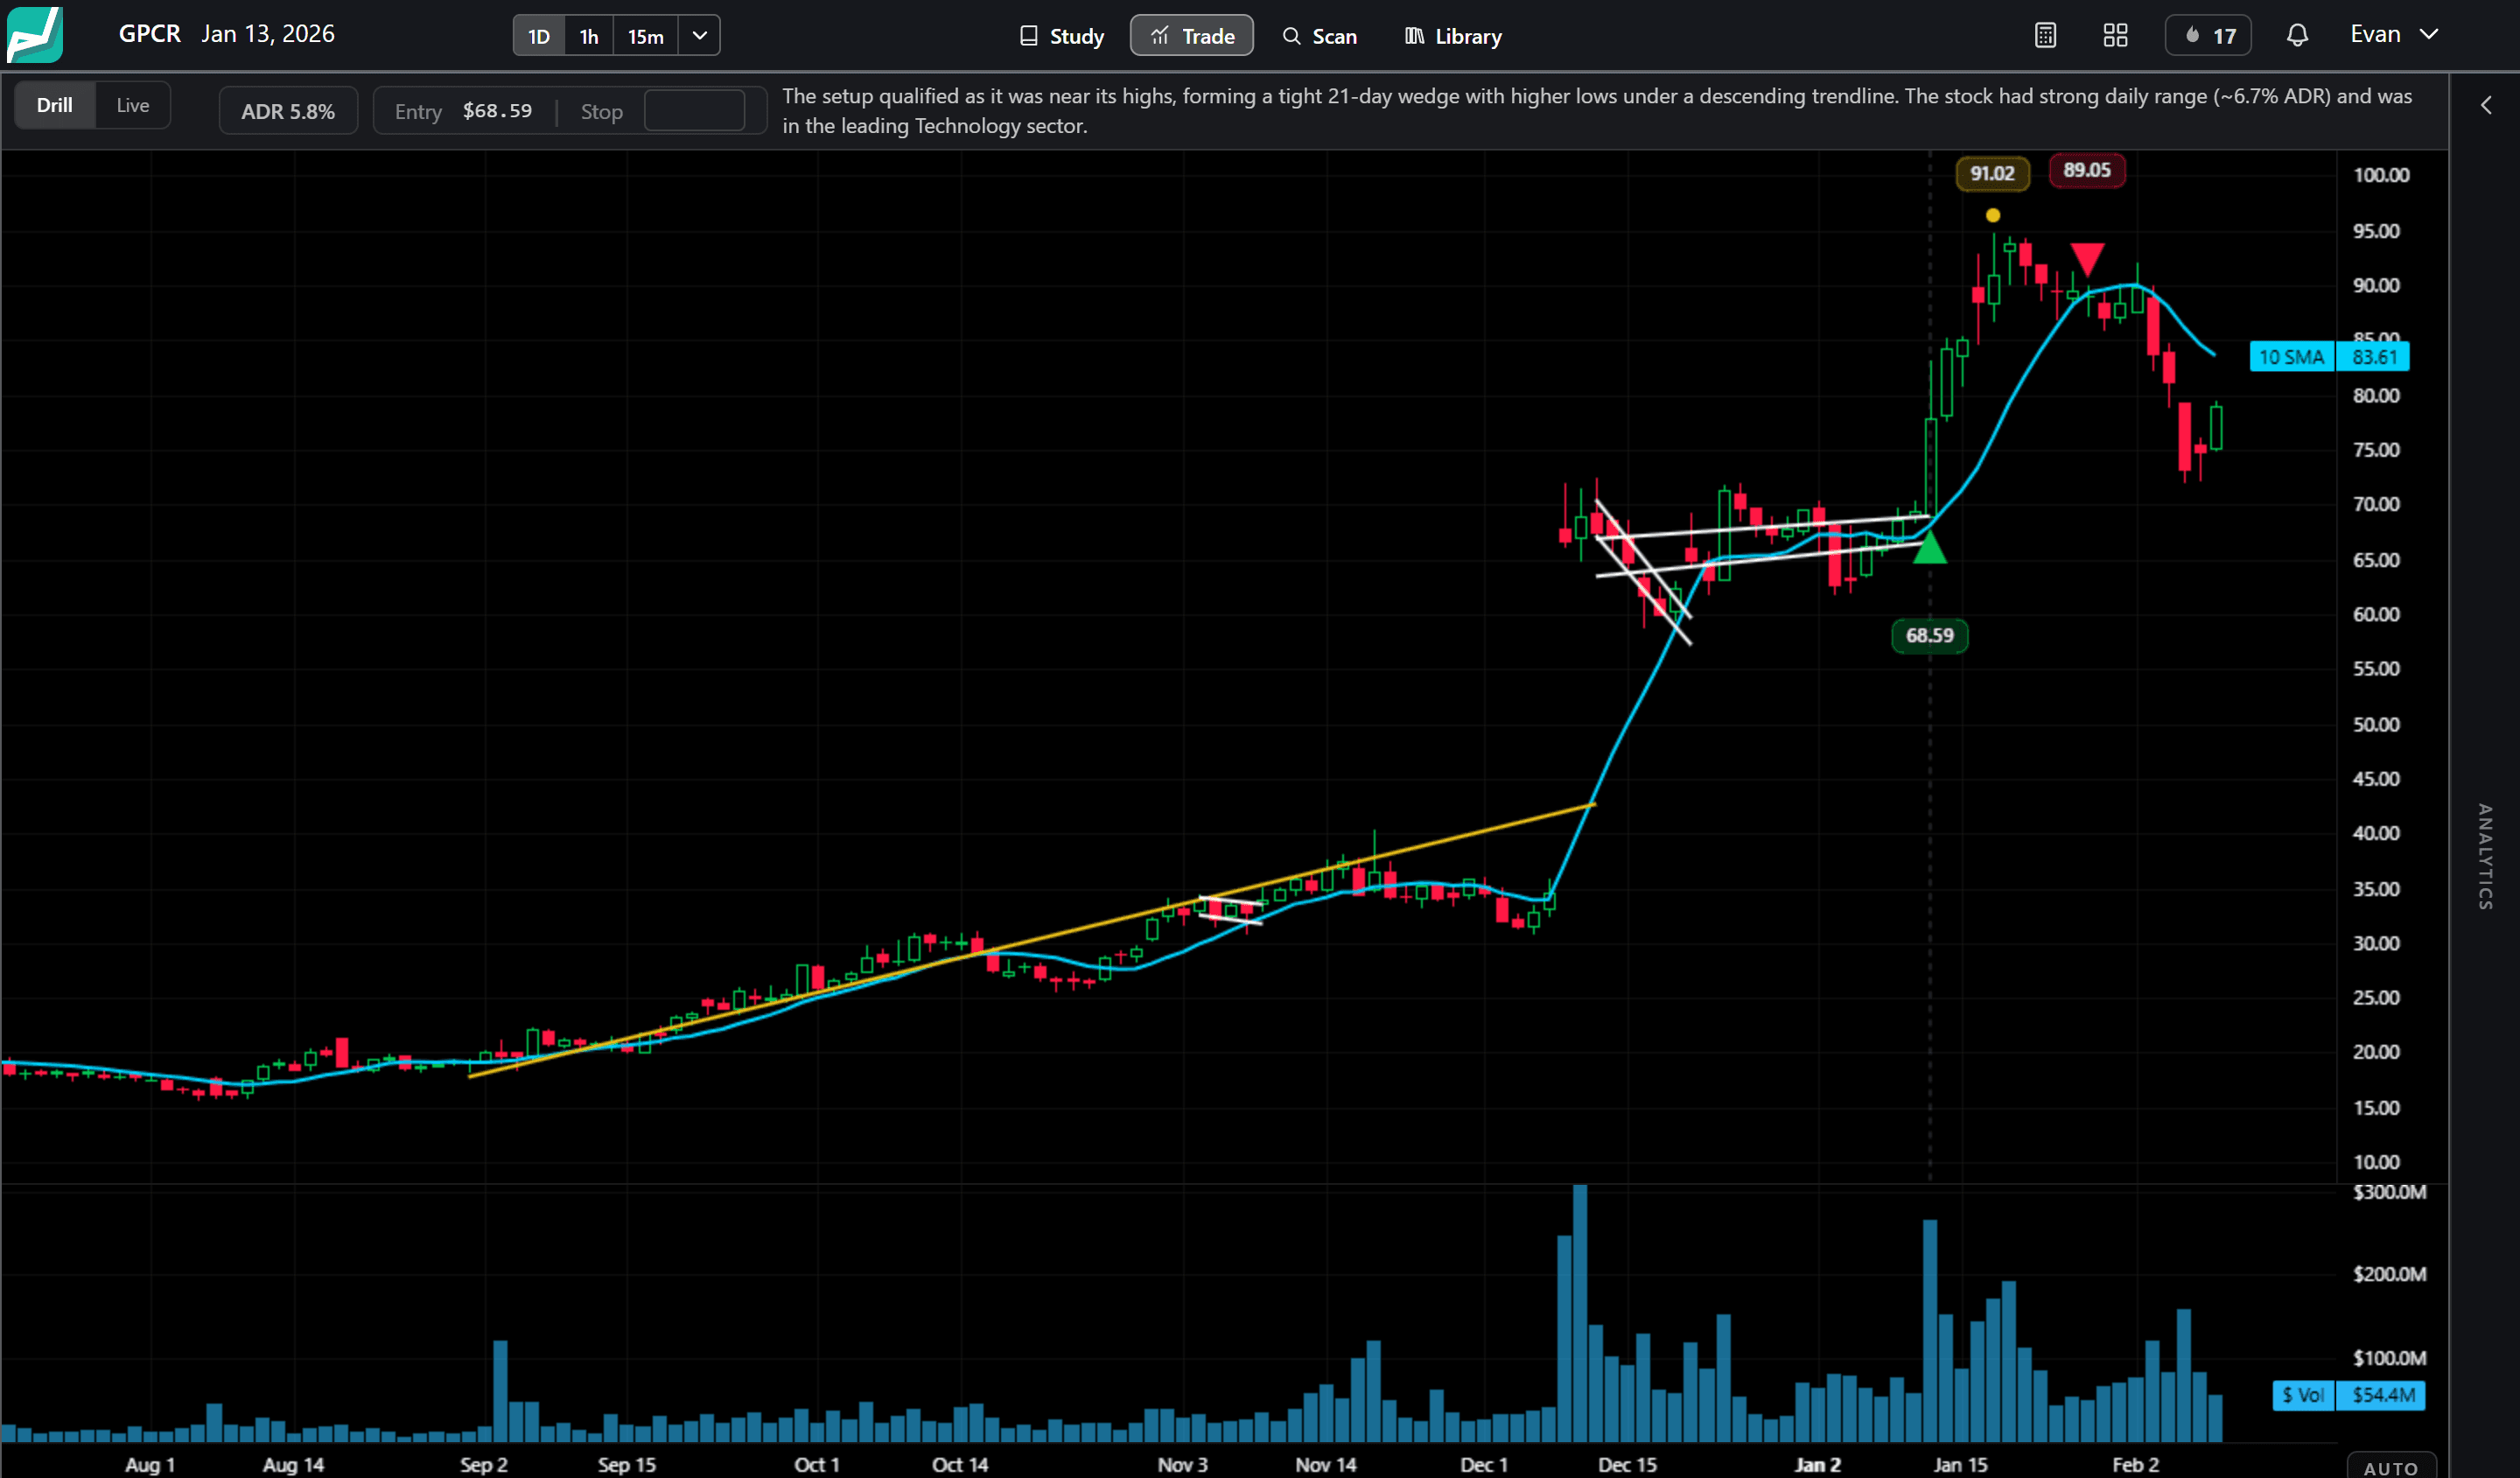
See a real chart frozen at the decision point. Call buy or skip. Watch the outcome. Repeat hundreds of times.
Trade the live scan
Every day the scanner runs those exact same rules. You get an alert when a base breaks out. You already know what to do.
The live scanner, every market day
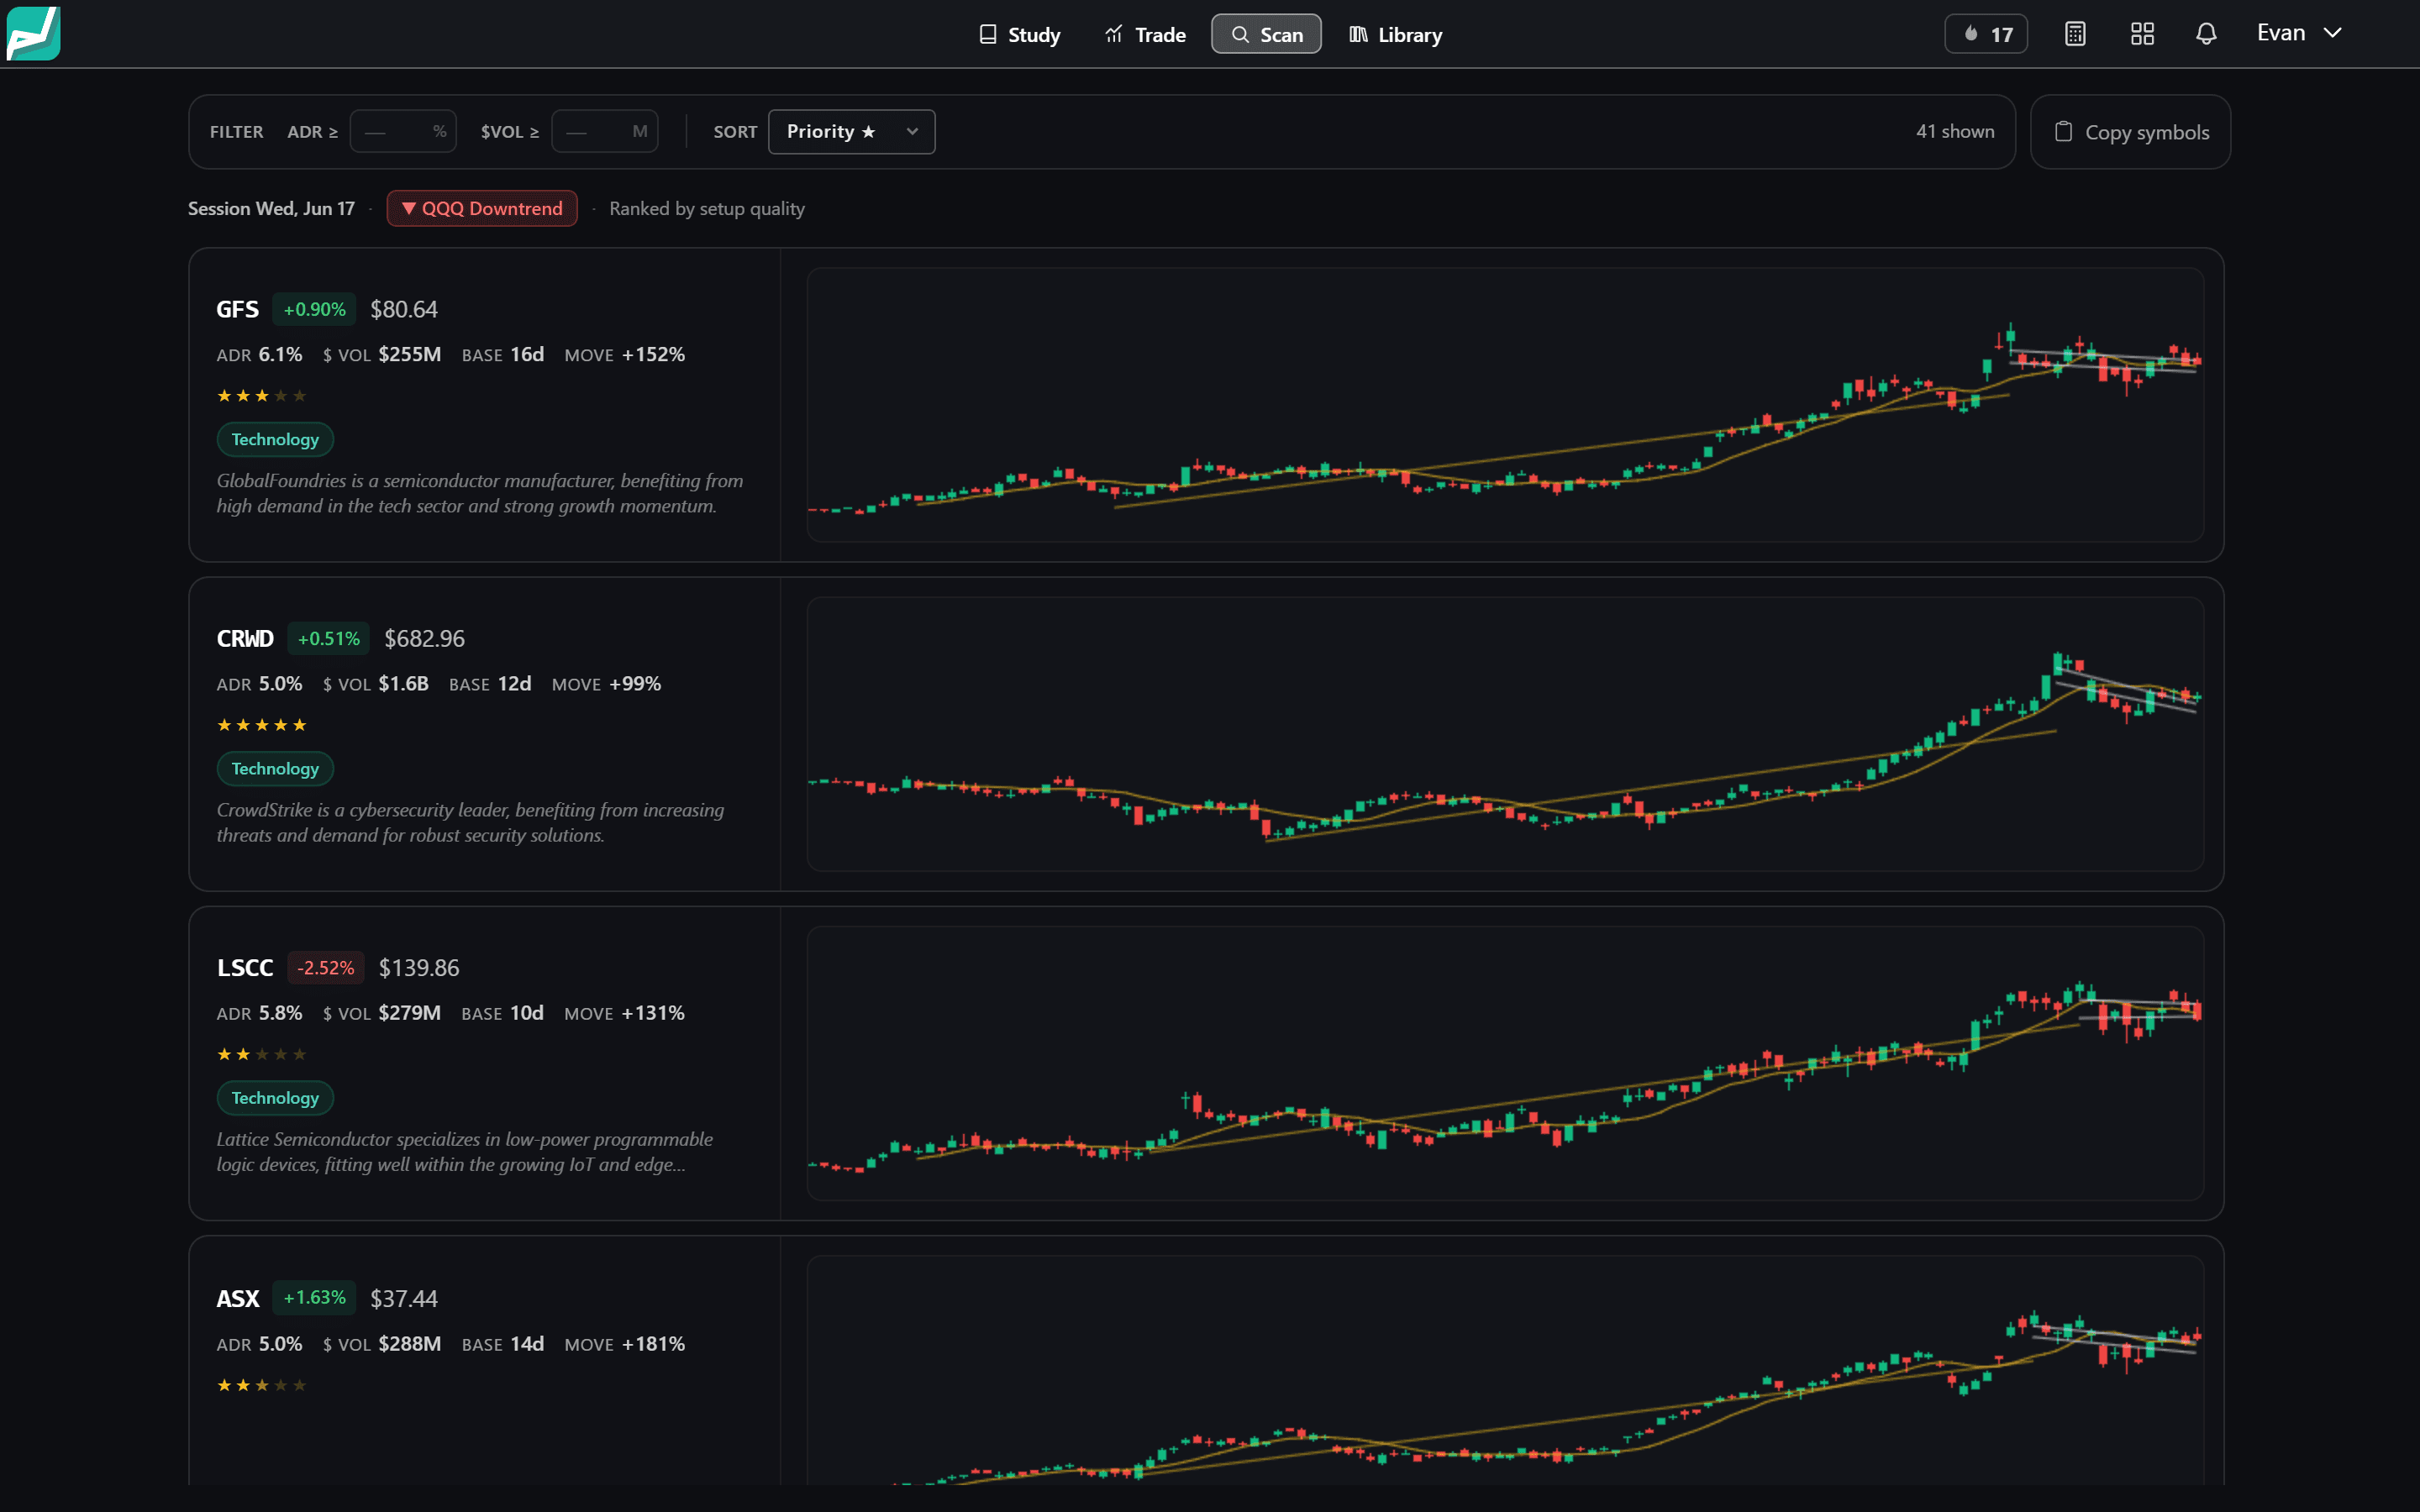
Setups ranked by pattern strength. Tap any row for the full daily chart and alert.
Winners are 7.1x bigger than losers. That is the whole edge.
Average winner: 9.95R. Average loser: 1.4R. The 36% win rate is not the signal. The size difference is. Most individual trades still lose.
Aggressively-sized backtest, not expected live results. Peak drawdown about 19% on a concentrated book.
Returns shown as percent. 2026 is a partial year.
What these numbers mean: Survivorship-free means failing and delisted stocks are included. The per-trade mean of 2.65R is small but statistically real (95% confidence interval excludes zero over 51,126 trades). Out-of-sample test years (2016 to 2026) produced mean R 2.72 vs. 2.52 in training: no decay out of sample.
Read the full researchFor the data nerds
95% CI on mean R: [2.55, 2.75] via bootstrap resampling over 51,126 trades. Both bounds positive, confirming the edge is not noise.
Profit factor 4.0x: Gross winners divided by gross losses across all 51,126 trades. Expectancy = 36% x 9.95R - 64% x 1.4R = 2.65R per trade.
QQQ regime filter: Trades are only taken when the market is in a risk-on regime (QQQ SMA10 above SMA20 and rising). This filters roughly half the calendar but improves the per-trade mean materially.
Sharpe: 1.63 annualized (rf = 0). Realized closed-trade drawdown peaked at 19%. Estimated intraday mark-to-market drawdown on a concentrated book: 19%.
Real stocks. Real decisions.
Every card is frozen at the decision point. You call it. Then the outcome plays out.
Breakout from tight 6-week base above prior range
Volume surge on base breakout, sector tailwind
Clean break above 8-week consolidation high
The drill deck has over 1,000 setups like these from 2005 to 2026. Real stocks, real outcomes. The scanner adds new ones daily.
Start free, no cardCommon questions
Do I need experience?
No. The Study section explains the rules from scratch. The drills reinforce them through repetition.
How long per drill?
About 1 to 2 minutes each. You see the chart, call buy or skip, see the outcome. You control the pace.
Is it real price data?
Yes. Every card is real OHLCV data for an actual stock, with the genuine post-breakout outcome revealed after you decide.
How is this different from paper trading?
Paper trading gives you one real-time setup at a time. This gives you hundreds of historical breakouts back-to-back. You build reps in days, not months.
Do I get alerts when a setup triggers?
Premium includes browser, email and SMS alerts when the scanner flags a new base, plus intraday alerts when one breaks out during the session.
Simple pricing. Start free.
7-day free trial on every paid plan. No card charged today.
Cancel anytime
About $9.92/mo
Pay once, premium for life
30-day money-back guarantee on all paid plans. Secure checkout via Stripe.
5 setups free, every day. No card needed.
Start now. Upgrade only if it clicks.
Start free, no cardMore questions?